
MatLab, Mathcad, Mathematica, Maple — что лучше? : Околонаучный софт
Пльзуюсь всем понемногу.Но из символьных вычислений больше всего Maple,немного MathCAD (но не 14! -поясню почему).Итак, кратко:
1)Maple -в связи сбыстрым развитием в последнее время эта система весьма хороша,особенно в связке с MatLab.Язык программирования несложный (что для истинного математика есть хорошо ).Кроме того -вам говорят -хотите на Фортране,MatLabe и других языках -вставляйте скрипты на здоровье!Редактор и интерфейс в последних версиях (10,11,12) по дружелюбности не уступает МэдГаду,а может и превосходит…Во всяком случае,электронный учебник я пишу в Maple…В плане ядра говорено-переговорено,оно меня устраивает,за исключением скорости.
2)Mathematica -в последних версиях наконец то стало монжо вертеть 3D графиками…но свойства на «лету»все равно не меняются…Язык,как ранее говорилось,сложнее…но,возможно,функциональнее…Ядро быстрее, чем у Maple.Так кажется (спец замеров не проводил).Что плохо?Система «сама в себе» -малая «открытость»….по сравнению с Maple…Символьные вычисления на уровне Maple,может где-то хуже,где-то лучше…Приложения -смотря как…например,функций для построения и анализа графов больше,чем в Maple 10 (в 11,12 появился спец тулбокс GraphTheory)
a) в MathCAD 14 x*hypergeom(1/4,1,5/4,-x^4) ,которая дает правильный результат приблизительно (если считать численно) при подстановки,например,Гауссовской гипергеометрической функции (формулу приводить не стану -сами знаете),которая в 14-й версии выглядит в виде fhyper…НО вычисляет (как оно в общем то и положено) в пределах от -1
b)В Maple символьный результат,с которым работать можно во во всем диапазоне действительных чисел.Можете проверить.
c) К слову,как известно,в версиях до 13 в МэдГаде использовалось ядро Maple V R4 …Так что такой интегральчик выдавался в таком же виде,как и в Maple..К слову,как известно,многие функции ядра Maple V (например,пакета LinearAlgebra) -работали с успехом и в MathCAD до 12 версии.Потом это дело «обрезали».
d) В Mathematica 6 выдается на гора результат,который дает еще и комплексное число!Действительная часть такая же как в Maple,но есть еще и мнимая!С этим надо разобраться…Предлагаю ВАМ это сделать,если угодно
4)Наконец,MatLab…тут нечего сказать,этот пакет не для символьных вычислений -а в остальном,делать можно что угодно…писать проги,моделировать и все-все все..Но нет тулбокса про Графы -приходится брать тулбоксы сторонней разработки или пользоватья тулбоксами линейного программирования..Вообще,графы -это не мое,но НАДО…..Один из наших докторов сказал:»MatLab неисчислим,как вселенная» К слову,свою магистерскую работу (как и последующие) я делал в MatLabe…Я моделировал по разработанной мной уникальной мат модели распространение ЭМ луча через неоднородности…Теперь предполагается сделать численно-аналитическую модель -и ядро Maple,зашитое в MatLab кстати…Да ведь можно подключать ядро Maple той версии,которая установлена на компе -это классно!
dxdy.ru
Что начать изучать MathCAD, Maple или MatLab?
← →michael_b (2003-03-23 14:03) [0]
Учусь на первом курсе мех-мата потребовалоcь выполнять громоздкие выклабди и тп и тд
← →
big_rom (2003-03-23 15:18) [1]
Лучьше матан. Даже если выкладки большие.(мое и только мое мнение)
← →
Mystic (2003-03-23 15:32) [2]
Я бы советовал MATLAB. Может для выполнения выкладок возможно это и не самое лучшее средство. Но как средство выполнения расчетов, создание программ, моделирования не имеет равных.
Если же ты имеешь склонности к программированию, то MATLAB предоставляет собственный язык программирования (с поддержкой GUI). Кроме того, почти все вычислительные алгоритмы представлены в исходниках. При желании их легко изменить/дополнить.
← →
DrPass (
Еще есть Mathematica — вообще для извращенцев технической мысли. Но вообще современный MathCAD способен удовлетворить все потребности инженера, и при этом совершенно не напрягать мозги. Я бы выбрал его.
← →
Mystic (2003-03-23 16:58) [4]
> вообще современный MathCAD способен удовлетворить все потребности
> инженера, и при этом совершенно не напрягать мозги.
Студента — да. Инженера — имхо, навряд-ли. В одно время MathCAD я откинул из-за малой функциональности + порекомендовали MATLAB. Просто интересно, что изменилось за это время. Есть ли
1. Считывание данных из внешних устройств.
2. Моделирование.
3. Генерирование C++ кода.
4. Генерирование готового для прошивки в ПЗУ кода для real-time систем (поддерживается до четырех тиов процессоров).
5. Идентификация систем. Нейронные сети. Нечеткая логика. Обработка изображений. …
6. Возможности расширения.
← →
jack128 (2003-03-23 19:19) [5]
Мне больше нравится MathCAD, для студента ИМХО больше подходит…
← →
nikkie (2003-03-23 20:12) [6]
Ну до кучи надо и за MAPLE вступиться.
Его сила — символьные вычисления. Я на нем считал, поскольку в него входят алгоритмы вычисления базиса Гребнера (символьное решение систем алгебраических уравнений). А если нужны теоретико-групповые вычисления, то надо использовать GAP.
← →
NetBreaker666 (2003-03-23 20:48) [7]
Все зависит от того, что требуеться ?
Если что-то поектировать, то — MathCAD — вообщем CAD есть CAD.
Если какие-то вычисления, которые базируются на преобразованиях матриц — MatLAB.
Для всего остального — Maple. Вообще я использую
только Maple, наверное, потому-что лично знаю человека, который руководит этим проектом, и еще пару человек из Waterloo да и сам чуть не стал участником проекта 🙂 Просто принято, что амтлаб лучше работает с матрицам, но я лично разницы не заметил, а Maple — всеравно удобней.
← →
Marser ( 2003-03-23 23:19) [8]
MathCad довольно мощный и очень простой в использовании.Для пределов, прозводных и инетегралов даже очень ничего.Остальное пока не пробовал, как и не пробовал в МачКаде диффуры и ряды.
← →
alxx (2003-03-24 10:50) [9]
У матлаба есть Symbolic Math Toolbox — Вот это действительно круто. Причем мне кажется, что MatLab очень гибкий — на нем можно программировать даже. Даже с базами данных работать. Даже картинки фильтровать. Много всего интересного.
← →
Думкин (2003-03-24 10:54) [10]
> big_rom © (23.03.03 15:18)
Абсолютно согласен. Особенно если речь идет о ММФ. На первых курсах — рользующимся калькулятором, надо руки отрубать.
Если хочешь понимать и знать математику — делай выкладки на бумаге. А с 1-го курса полезешь в эти вещи — быть тебе обезьяной — аминь.
← →
Внук (2003-03-24 11:14) [11]
Не хочу вступать в долгие дискуссии о том, что круче. Просто выскажу свое мнение :)
Я выбираю Maple.
Специальность моя — «Прикладная математика, механика», скоро диссертацию защищаю. Вполне хватает.
← →
michael_b (2003-03-24 19:15) [12]
> big_rom © (23.03.03 15:18)
> Думкин © (24.03.03 10:54)
Да я чтоб проверить правильно-ли на бумаге сосчитал. А изучать хочется сразу что-то перспективное, что пригодится в будущем. Вдруг я стану инженером или еще кем-нибудь, кому это пригодится.
← →
Mystic (2003-03-25 01:46) [13]
Некоторые возможности MATLAB
Basic feature:
Math and computation
Algorithm development
Modeling, simulation, and prototyping
Data analysis, exploration, and visualization
Scientific and engineering graphics
Application development, including graphical user interface
building
Visually model and simulate complex reactive systems based
on finite state machine theory.
Design and develop deterministic, supervisory control systems.
Easily modify your design, evaluate the results, and verify
the system»s behavior at any stage of your design.
from your design (requires Stateflow Coder).
Take advantage of the integration with the MATLAB and Simulink
environments to model, simulate, and analyze your system.
Transform your model into executable real-time code.
Rapid prototyping for control systems and digital signal
processing applications.
xPC Target is part of a family of software products that you use
to create real-time control systems. Some of these products are
required while others you use for special applications.
The Data Acquisition Toolbox is a collection of M-file functions
and MEX-file dynamic link libraries (DLLs) built on the MATLABо
Technical Computing Environment. The toolbox provides you with
these main features:
A framework for bringing live, measured data into MATLAB using
PC-compatible, plug-in data acquisition hardware
National Instruments E Series and 1200 Series boards
ComputerBoards (Measurement Computing Corporation) boards
Agilent Technologies E1432A/33A/34A VXI modules
Microsoft Windows sound cards
Additionally, you can use the Data Acquisition Toolbox Adaptor
Kit to interface unsupported hardware devices to the toolbox.
Support for analog input (AI), analog output (AO), and digital
I/O (DIO) subsystems including simultaneous AI and AO
conversions
Data buffering for background acquisitions
Data logging
Event-driven acquisitions
The CDMA Reference Blockset is a collection of Simulinkо blocks
designed to help you develop and simulate CDMA wireless communication
systems, based on the current North American IS-95A CDMA (code
division multiple access) standard.
The Communications Toolbox is a set of MATLABо functions that can
help you design and analyze advanced communication systems.
Functions in the toolbox can accomplish these tasks:
Random signal production
Error analysis, including eye diagrams and scatter plots
Source coding, including scalar quantization, differential pulse
code modulation, and companders
Error-control coding, including convolutional and linear block coding
Analog and digital modulation/demodulation
Filtering of data using special filters
Computations in Galois fields
The Communications Blockset is a collection of Simulinkо blocks designed
for research, development, system design, analysis, and simulation in the
communications area. You can use the blockset»s ready-to-use blocks
directly, or you can easily modify them to implement your own methods and
algorithms. Blocks in this product can model various processes within
communication systems, including:
Signal generation
Source coding
Error-control coding
Interleaving
Modulation/demodulation
Transmission along a channel
Synchronization
← →
Mystic (2003-03-25 01:48) [14]
MATLAB has a rich collection of functions immediately useful to the control
engineer or system theorist. Complex arithmetic, eigenvalues, root-finding,
matrix inversion, and FFTs are just a few examples of MATLAB»s important
numerical tools. More generally, MATLAB»s linear algebra, matrix computation,
and numerical analysis capabilities provide a reliable foundation for control
system engineering as well as many other disciplines.
The Database Toolbox is one of an extensive collection of toolboxes for
use with MATLABо. The Database Toolbox enables you to move data (both
importing and exporting) between MATLAB and popular relational databases.
This book describes the Datafeed Toolbox for MATLABо. The Datafeed Toolbox
enables MATLAB users to obtain financial data from a financial data server
and to enter this data into the MATLAB environment.
The DSP Blockset brings the full power of Simulinkо to DSP system design
and prototyping by providing key DSP algorithms and components in
Simulink»s adaptable block format. The blockset gives you the core
components such as buffers, linear algebra solvers, dyadic filter banks,
and parametric estimators that allow you to rapidly and efficiently
assemble complex DSP systems.
Excel Link is a software add-in that integrates Microsoft Excel and MATLAB
in a Microsoft Windows-based computing environment. By connecting Excel and
MATLAB, you can access the numerical, computational, and graphical power of
MATLAB from Excel worksheet and macro programming tools. Excel Link lets
you exchange and synchronize data between the two environments.
Filter Design Toolbox is a collection of tools built on top of the MATLAB
computing environment and the Signal Processing Toolbox. The toolbox includes
a number of advanced filter design techniques that support designing,
simulating, and analyzing fixed-point and custom floating-point filters
for a wide range of precisions.
MATLAB and the Financial Toolbox provide a complete integrated computing
environment for financial analysis and engineering. The toolbox has everything
you need to perform mathematical and statistical analysis of financial data
and display the results with presentation-quality graphics. You can quickly
ask, visualize, and answer complicated questions.
Compute and analyze prices, yields, and sensitivities for derivatives and
other securities, and for portfolios of securities.
Perform Securities Industry Association (SIA) compatible fixed-income
pricing, yield, and sensitivity analysis.
Analyze or manage portfolios.
Design and evaluate hedging strategies.
Identify, measure, and control risk.
Analyze and compute cash flows, including rates of return and depreciation
streams.
Analyze and predict economic activity.
Create structured financial instruments, including foreign-exchange
instruments.
Teach or conduct academic research.
The Financial Derivatives Toolbox computes pricing and sensitivities of interest
rate contingent claims based upon sets of zero coupon bonds or the Heath-Jarrow-
Morton (HJM) evolution model of the interest rate term structure.
This book describes the Financial Time Series Toolbox for MATLAB, a collection of
tools for the analysis of time series data in the financial markets. Financial
engineers working with time series data, such as equity prices or daily interest
fluctuations, can use this toolbox for more intuitive data management than with
regular vectors or matrices.
← →
Mystic (2003-03-25 01:49) [15]
The Fixed-Point Blockset includes a collection of blocks that extend the standard
Simulink block library. With these blocks, you can create discrete-time dynamic
systems that use fixed-point arithmetic. As a result, Simulink can simulate
effects commonly encountered in fixed-point systems for applications such as
control systems and time-domain filtering. The Fixed-Point Blockset includes
these major features:
Integer, fractional, and generalized fixed-point data types:
Unsigned and two»s complement formats
Word size from 1 to 128 bits
Floating-point data types:
IEEE-style singles and doubles
A nonstandard IEEE-style data type, where the fraction (mantissa) can range
from 1 to 52 bits and the exponent can range from 1 to 11 bits
Methods for overflow handling, scaling, and rounding of fixed-point data types
Tools are provided to facilitate:
The collection of minimum and maximum simulation values
The optimization of scaling parameters
The display of input and output signals
With the Real-Time Workshopо, you can generate C code for execution on a
fixed-point embedded processor; the generated code uses only integer types
and automatically includes all operations, such as shifts, needed to account
for differences in fixed-point locations
The Fuzzy Logic Toolbox is a collection of functions built on the MATLABо numeric
computing environment. It provides tools for you to create and edit fuzzy inference
systems within the framework of MATLAB, or if you prefer you can integrate your fuzzy
systems into simulations with Simulinkо, or you can even build stand-alone C
programs that call on fuzzy systems you build with MATLAB. This toolbox relies heavily
on graphical user interface (GUI) tools to help you accomplish your work, although
you can work entirely from the command line if you prefer.
MATLAB and the GARCH Toolbox provide an integrated computing environment for modeling
the volatility of univariate economic time series. The GARCH Toolbox uses a general
ARMAX/GARCH composite model to perform simulation, forecasting, and parameter
estimation of univariate time series in the presence of conditional heteroskedasticity.
Supporting functions perform tasks such as pre- and post-estimation diagnostic testing,
hypothesis testing of residuals, model order selection, and time series transformations.
Graphics capabilities let you plot correlation functions and visually compare matched
innovations, volatility, and return series. More specifically, you can:
Perform Monte Carlo simulation of univariate returns, innovations, and conditional
volatilities
Specify conditional mean models of general ARMAX form and conditional models of
general GARCH form for univariate asset returns
Estimate parameters of general ARMAX/GARCH composite models via the maximum
likelihood method
Generate minimum mean square error forecasts of the conditional mean and conditional
variance of univariate return series
Perform pre- and post-estimation diagnostic and hypothesis testing, such as Engle»s
ARCH test, Ljung-Box Q-statistic test, likelihood ratio tests, and AIC/BIC model
order selection
Perform graphical correlation analysis, including auto-correlation, cross-correlation,
and partial auto-correlation
Convert price/return series to return/price series, and transform finite-order ARMA
models to infinite-order AR and MA models
The Image Processing Toolbox is a collection of functions that extend the capability
of the MATLABо numeric computing environment. The toolbox supports a wide range of
image processing operations, including:
Geometric operations
Neighborhood and block operations
Linear filtering and filter design
Transforms
Image analysis and enhancement
Binary image operations
Region of interest operations
← →
Mystic (2003-03-25 01:50) [16]
The Instrument Control Toolbox is a collection of M-file functions built on the MATLAB
Technical Computing Environment. The toolbox provides you with these features:
A framework for communicating with instruments that support the GPIB interface
(IEEE-488, HPIB), the VISA standard, and the serial port interface (RS-232, RS-422,
and RS-485). Note that the toolbox extends the basic serial port features included
with MATLAB.
Functions for transferring data between MATLAB and your instrument:
The data can be binary (numerical) or text.
Text data can be any command used by your instrument such as a command given by
the Standard Commands for Programmable Instruments (SCPI) language.
The transfer can be synchronous and block the MATLAB command line, or asynchronous
and not block the MATLAB command line.
Event-based communication
Functions for recording data and event information to a text file
Tools that facilitate instrument control in an easy-to-use graphical environment
Welcome to the Mapping Toolbox for MATLABо. The Mapping Toolbox allows you to read,
analyze, and display geographic information within MATLAB. Since the earth and most
heavenly bodies are generally spherical in shape, geographic data is usually defined
on a spherical or elliptical coordinate system. Distance, azimuth, area, and even
straight lines on the curved surface of the earth are defined differently than in
MATLAB»s cartesian coordinates.
The MATLAB о C Math Library makes the mathematical core of MATLAB available to
application programmers. The library is a collection of more than 400 mathematical
routines written in C. Programs written in any language capable of calling C functions
can call these routines to perform mathematical computations.
The MATLAB C/C++ Graphics Library is a collection of MATLAB graphics routines
distributed as a single library. The graphics library makes the MATLAB plotting and
visualization capabilities available to stand-alone C and C++ applications.
The MATLAB Compiler automatically converts MATLAB M-files to C and C++ code. By
using the Compiler with the MATLAB C/C++ Math and Graphics Libraries you can
automatically convert your MATLAB applications that contain math and graphics to C
and C++ code for standalone applications.
The Motorola DSP Developer»s Kit enables you to develop application software for
Motorola DSPs in the MathWorks MATLAB and Simulink environments. It provides an
object-oriented interface to program MEX-files or S-functions that call the appropriate
Motorola Suite56 DSP Simulator.
The Model Predictive Control (MPC) Toolbox is a collection of functions (commands)
developed for the analysis and design of model predictive control (MPC) systems.
Model predictive control was conceived in the 1970s primarily by industry. Its
popularity steadily increased throughout the 1980s. At present, there is little
doubt that it is the most widely used multivariable control algorithm in the chemical
process industries and in other areas. While MPC is suitable for almost any kind of
problem, it displays its main strength when applied to problems with:
A large number of manipulated and controlled variables
Constraints imposed on both the manipulated and controlled variables
Changing control objectives and/or equipment (sensor/actuator) failure
Time delays
The m-Analysis and Synthesis Toolbox (m-Tools) is a collection of functions (commands)
developed primarily for the analysis and synthesis of control systems, with an emphasis
on quantifying the effects of uncertainty. m-Tools provides a consistent set of data
structures for the unified treatment of systems in either a time domain, frequency
domain, or state-space manner. m-Tools also gives MATLAB users access to recent
developments in control theory, namely H_inf optimal control and m analysis and
synthesis techniques. This package allows you to use sophisticatedmatrix perturbation
results and optimal control techniques to solve control design problems. Control design
software, such as m-Tools, provides a link between control theory and control
engineering.
← →
Mystic (2003-03-25 01:51) [17]
The Nonlinear Control Design (NCD) Blockset provides a Graphical User Interface (GUI)
to assist in time domain based control design. With this blockset, you can tune parameters
within a nonlinear SIMULINKо model to meet time domain performance requirements by
graphically placing constraints within a time domain window. Any number of SIMULINK
variables including scalars, vectors, and matrices can be declared tunable by entering
the variable name into the appropriate dialog box. Uncertainty bounds can be placed on
other variables in the model for robust control design. The NCD Blockset makes attaining
performance objectives and optimizing tunable parameters an intuitive and easy process.
Neural networks are composed of simple elements operating in parallel. These elements are
inspired by biological nervous systems. As in nature, the network function is determined
largely by the connections between elements. We can train a neural network to perform a
particular function by adjusting the values of the connections (weights) between
elements.
The Partial Differential Equation (PDE) Toolbox provides a powerful and flexible environment
for the study and solution of partial differential equations in two space dimensions and time.
The equations are discretized by the Finite Element Method (FEM). The objectives of the PDE
Toolbox are to provide you with tools that:
Define a PDE problem, i.e., define 2-D regions, boundary conditions, and PDE coefficients.
Numerically solve the PDE problem, i.e., generate unstructured meshes, discretize the
equations, and produce an approximation to the solution.
Visualize the results.
Electrical power systems are combinations of electrical circuits, and electro-mechanical
devices, like motors and generators. Engineers working in this discipline are constantly
asked to improve the performance of the systems. Requirements for drastically increased
efficiency have forced power system designers to use power electronic devices and
sophisticated control system concepts that tax traditional analysis tools and techniques.
Further complicating the analyst»s role is the fact that the system is often so nonlinear,
the only way to understand it is through simulation.
The Requirements Management Interface allows you to associate requirements with Simulink
models, Stateflowо diagrams, and MATLABо M-files. There is a standard version of the
Requirements Management Interface and a version that works with the DOORS requirements
management system, a product offering from Quality Systems & Software, Inc. (QSS).
The Report Generator is a software package that can take any information from your MATLAB
workspace and export it to a document in the form of a report. The reports that you create
with the Report Generator can include figures, data, variables, and functions from your
models or M-files, as well as snapshots of system graphics and figures.
The Robust Control Toolbox is written in M-files using the matrix functions of the Control
System Toolbox and MATLAB. It enables you to do УrobustФ multivariable feedback control
system modeling, analysis and design based on the singular-value Bode plot. Many of the
functions described in the Robust Control Toolbox UserТs Guide incorporate theory originally
developed at USC by the authors. The early version of the Robust Control Toolbox called LINF
was distributed widely.
← →
Mystic (2003-03-25 01:53) [18]
The Signal Processing Toolbox is a collection of tools built on the MATLABо numeric computing
environment. The toolbox supports a wide range of signal processing operations, from waveform
generation to filter design and implementation, parametric modeling, and spectral analysis.
This toolbox contains MATLAB versions of the essential programs of the B-spline package
(extended to handle also vector-valued splines) as described in A Practical Guide to Splines,
(Applied Math. Sciences Vol. 27, Springer Verlag, New York (1978), xxiv + 392p), hereafter
referred to as PGS. The toolbox makes it easy to create and work with piecewise-polynomial
functions.
The Symbolic Math Toolboxes incorporate symbolic computation into MATLABо»s numeric
environment. These toolboxes supplement MATLAB»s numeric and graphical facilities with
several other types of mathematical computation.
Calculus: Differentiation, integration, limits, summation, and Taylor series
Linear Algebra: Inverses, determinants, eigenvalues, singular value decomposition,
and canonical forms of symbolic matrices
Simplification: Methods of simplifying algebraic expressions
Solution of Equations: Symbolic and numerical solutions to algebraic and differential
equations
Special Mathematical Functions: Special functions of classical applied mathematics
Variable-PrecisionArithmetic: Numerical evaluation of mathematical expressions to any
specified accuracy
The System Identification Toolbox is for building accurate, simplified models of complex
systems from noisy time-series data. It provides tools for creating mathematical models of
dynamic systems based on observed input/output data. The toolbox features a flexible
graphical user interface that aids in the organization of data and models. The identification
techniques provided with this toolbox are useful for applications ranging from control system
design and signal processing to time-series analysis and vibration analysis. Michel Misiti,
Georges Oppenheim, and Jean-Michel Poggi are mathematics professors at Ecole Centrale de Lyon,
University of Marne-La-Vallee and Paris 5 University. Yves Misiti is a research engineer
specialized in Computer Sciences at Paris 11 University.
ИМХО, кое-что из этого может пригодиться…
← →
Думкин (2003-03-25 04:50) [19]
> michael_b (24.03.03 19:15)
Ну, тогда — все пробовать надо.
Но у нас больше от от пакета Mathematic пищат. Книг по нему — проблемно, и в основном дерьмо полное, но возможностей там — вагон, с тележкой. Интерфейс беднее, чем в приведенных — но мощь — посильнее, видимо.
Для не очень больших наворотов — MathCad идет — для первого курса хватит.
Но если все это лицензионное — то деньги не маленькие.
← →
Kapusto (2003-03-25 09:04) [20]
Если надо просто числа перемолоть, лабораторку там обработать — проще всего в MathCAD»e…
А вот для символьных вычислений лучше MATLAB, использовал помнится и Mathеmatic»у, но к ее интерфейсу так привыкнуть и не смог…
Но… Но… Но… в любом случае необходимо _точное_ знание того, что должно получиться в результате, т.е. очень хорошее знание предметной области… 🙂
delphimaster.net
MatLab, Mathcad, Mathematica, Maple — что лучше? : Околонаучный софт
Я по профессии радиотехник. Работа связана с проектированием цифровых микропроцессорных систем, в том числе обработка сигналов на DSPs. Насколько мне известно из нашей «братии» народ пользуется только может быть Matlab’ом и всё, да и то, только для того, чтобы по-быстрому рассчитать коэффициенты фильтров и сравнить результат с какой бесплатной тулзой.Сам я пользуюсь Mathcad’ом в основном, т.к. освоил его вдоль и поперёк. Иногда пользуюсь и Matlab’ом, ещё реже Maple’ом. DSP’шникам не нужны возможности по символьным вычислениям, т.к. они работают «на готовых формулах», т.е. нужно просто применять уже известное, подобрав нужные численные коэффициенты.
Mathcad теперь (MC14, что на рапидшаре) имеет в себе подключенные сигнальный пак и пак для работы с изображениями, которые ранее нужно было доставать отдельно (и, как правило, ими никто не пользовался). Я люблю этот пакет за простоту навигации и операций типа копи/паст, все формулы можно буквально разбросать и потом собирать нужный расчёт как пазл. Это требует усилий по освоению его интерфейса. Также он мне нравится за возможность простого расширения функций своими, путём подключения очень не хитрых библотек (dll). В Matlab’е теже библиотеки устроены по-хитрее. Про работу с изображениями вообще можно сказать, что очень удобно, когда видишь перед глазами все картинки и результаты работы с ними.
Matlab нравится за обилие функций. В общем, там есть всё, что могло бы мне когда нить понадобиться. Я также из тех людей, которые уважают командный интерфейс.
Ну, а Maple нужен скорее студентам только и, возможно, аспирантам, т.к. чтобы профессионально в нём работать нужно быть не плохо, а очень хорошо быть подкованным одновременно в программировании и математике, что встретить можно далеко не часто.
Пару лет назад, когда я по совместительству работал в одной начинающей фирме, которая разрабатывала алгоритмы сжатия изображений на основе вейвлетов, у нас был коллектив математиков (большинство уже в возрасте), которые все расчёты делали буквально в уме и при помощи бумаги. Если же что-то надо было проверить, то привлекали программистов, причём тех, которые ваяли алгоритмы и проверяли их на С++, а не при помощи мат. макетов (хотя я был исключением). В разработке же алгоритмов вполне мог помочь тот же Maple, откидывая, например, заведомо неверные результаты. Но, чтобы его применять для изобретения чего-то нового нужен большой опыт применения.
Поэтому каждому своё. Хорошо, что все они есть. Но хотя бы каким-то нужно владеть как основным инструментом, если он помогает в работе.
dxdy.ru
Функциональность.
MathCad – это программа, позволяющая работать в очень тесной интеграции как с другими системами (Word, Excel и пр.), так и эффективно использовать Web-технологии. Не выходя из среды MathCad, можно открывать новые документы на других серверах и пользоваться всеми преимуществами информационных технологий, предоставляемых Интернет.
Пакет MathCad – это полноценное Windows-приложение. В MathCad встроена мощная справочная база с множеством примеров, подсказок и качественной системой поиска.
MathCad – это среда для выполнения на компьютере разнообразных математических и инженерно-технических расчетов, предоставляющая пользователю обширный набор инструментов для реализации графических, аналитических и численных методов решения математических задач различной сложности в любой области, где применяются математические методы.
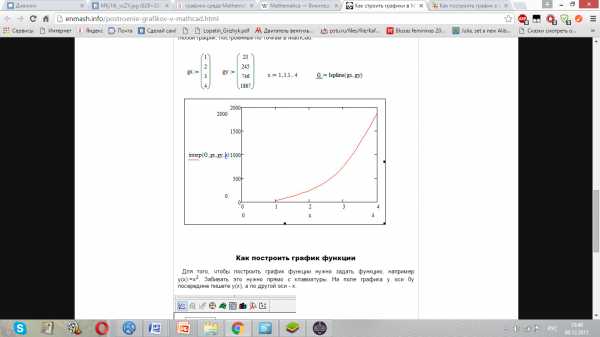
Рисунок 1 – Построение графиков
Особенность.
Основное отличие MathCad, что в ней математические выражения представляются в общепринятой математической нотации, то есть, имеют точно такой же вид, как в книге, тетради, на доске. Такая запись на языке, очень близком к стандартному языку математических расчетов, упрощает постановку и решение задач.
Структура пакета.
Вычислитель программы MathCad, обеспечивает вычисление по математическим формулам, имеет большой набор встроенных математических функций, позволяет вычислять ряды, определенный интеграл, производные, работать с комплексными числами, решать линейные и нелинейные уравнения, проводить минимизацию функции, выполнять векторные и матричные операции, решать дифференциальные уравнения и уравнения в частных производных, проводить анализ временных рядов и статистический анализ данных от простейших описательных статистик до дисперсионного анализа и метода Монте-Карло и т.д. Позволяет легко менять разрядность чисел и погрешность интеграционных методов. Для ввода формул используются шаблоны, вводимые определенными комбинациями клавиш. Имеется возможность изменения формата представления чисел, например, количества знаков после десятичной точки, погрешности вычислений и обозначения мнимой единицы при операциях с комплексными числами.
Графический процессор позволяет строить двумерные графики в декартовой и в полярной системе координат, с масштабной сеткой и без нее, с линейным и логарифмическим масштабом и т.д., трехмерные графики поверхностей, точечные графики и графики векторных полей, вводить в графики элементы анимации, осуществлять трассировку. Задание вида и размера графика осуществляется вводом соответствующего формата.
Интерфейс пакета.
Системные требования. Для MathCad 2001 достаточно 16 Mb оперативной памяти. Но при решении многих задач, таких как: применение численного метода вычисления кратного интеграла или решения дифференциального уравнения, построение 3D-графика, анимация и других подобных случаях, — лучше использовать более мощную машину, иначе процесс подсчета может затянуться.
Рабочая область. Белые листы MathCad – это логически активная зона, чтение информации в которой осуществляется сверху вниз и слева направо. То есть, чтобы получить значение функции при некотором значении аргумента, значение аргумента должно быть определено выше или левее ее самой. Иначе будет выдано сообщение об ошибке: «Переменная или функция не определена выше» – «Variable or function is not defined above». К вводу формул можно приступить после того, как сделаны все предварительные настройки.
studfiles.net